Only all auction insight metrics are supported with Search campaigns, running the scripts for Google Shopping will work but it will only generate the auction insight metrics that Shopping supports.
Auction insights per competitor are notoriously difficult to automate and get as it’s not available in the Google Ads API at all. So because of that, I created these scripts. It will organize all the auction insights data on all your competitors and create charts on impression shares, top of page rates, overlap rates etc. Those charts are updated each day that the script runs, getting as close to an automated dashboard as possible. There's two versions of the script: one that is easy to setup, but requires manual updating of the URL in the script. The second version is a full-fledged automation, but a little bit more difficult (though not hard) to setup.
Setup
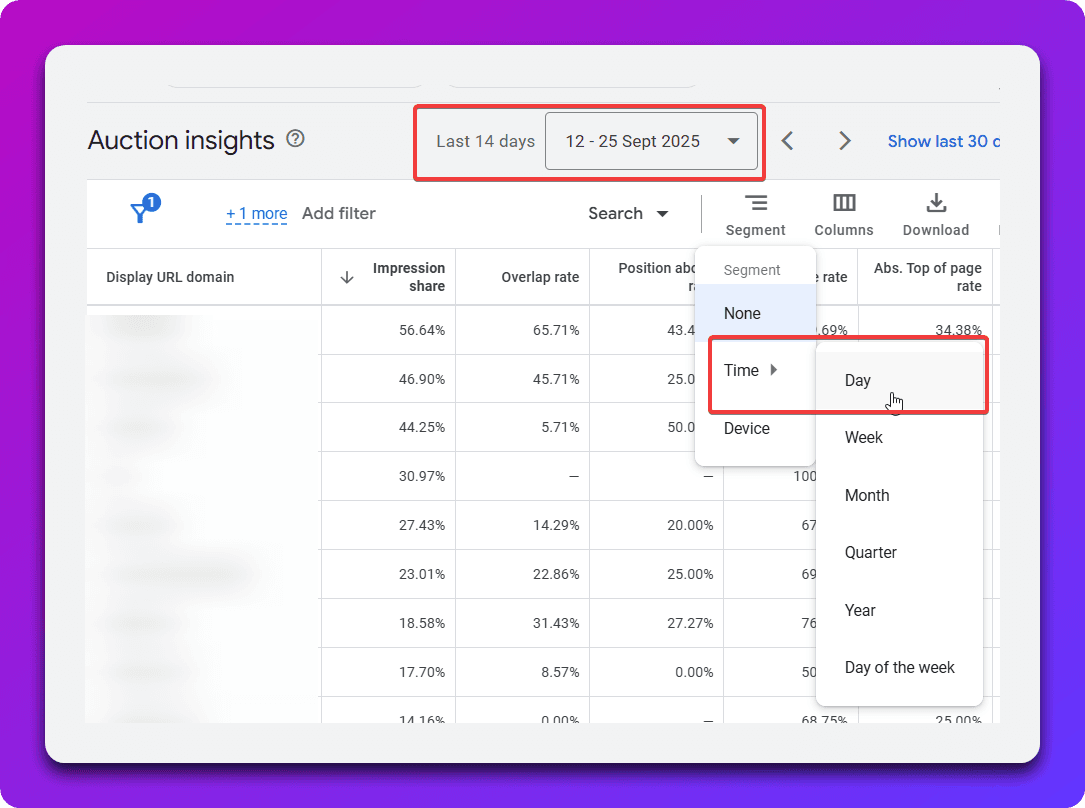
For either version of the script, this setup needs to happen. First, select the campaigns for which you want the auction insights to generate, and then press the auction insights button.

Now, you need to select a date range of the last 14 days (or however many last days you want, up until 15 days), and segment the date by time -> day. Unfortunately, you cannot take a scheduled date range segmented by date of more than 15 days.
Now that you've done that, we need to schedule it in a Google Spreadsheet.
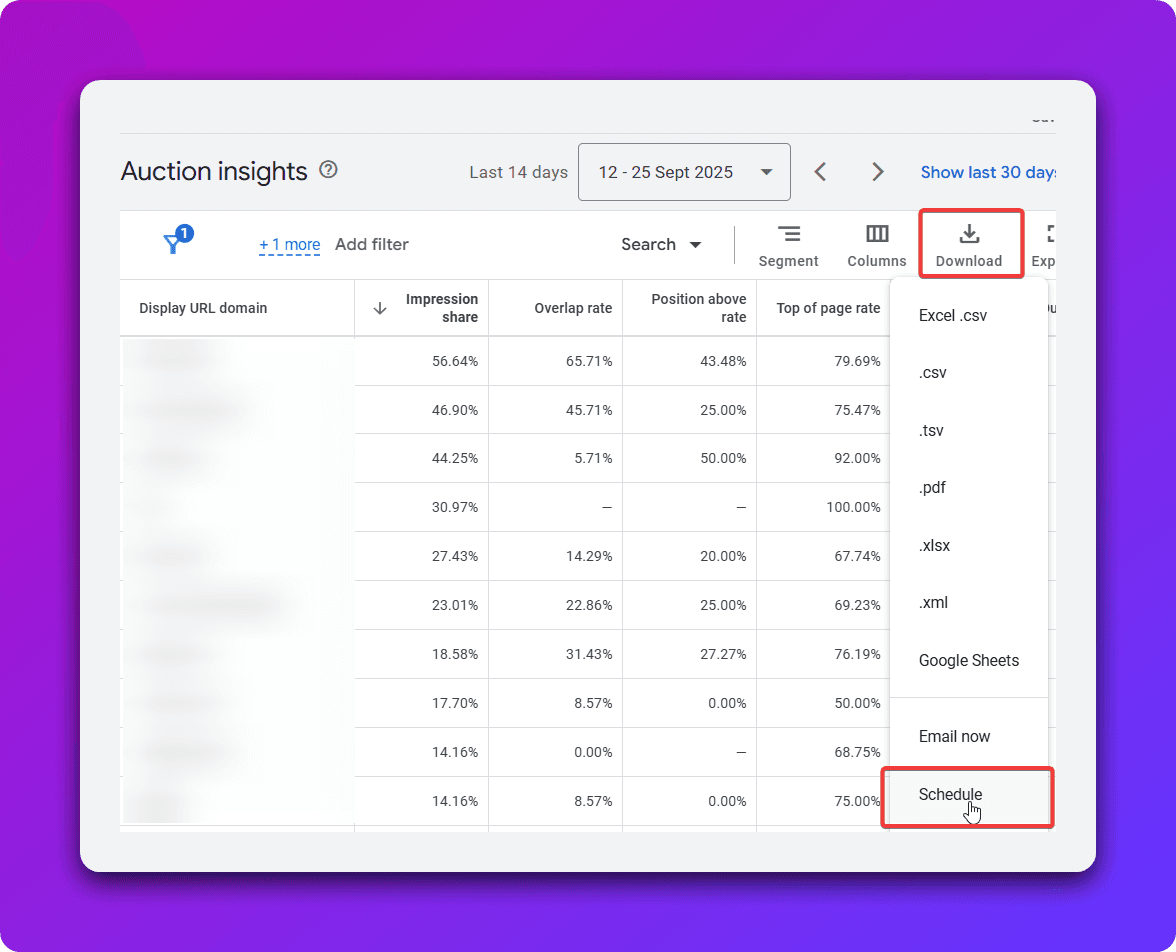
This will open up the following menu, make sure you select Google Sheets.
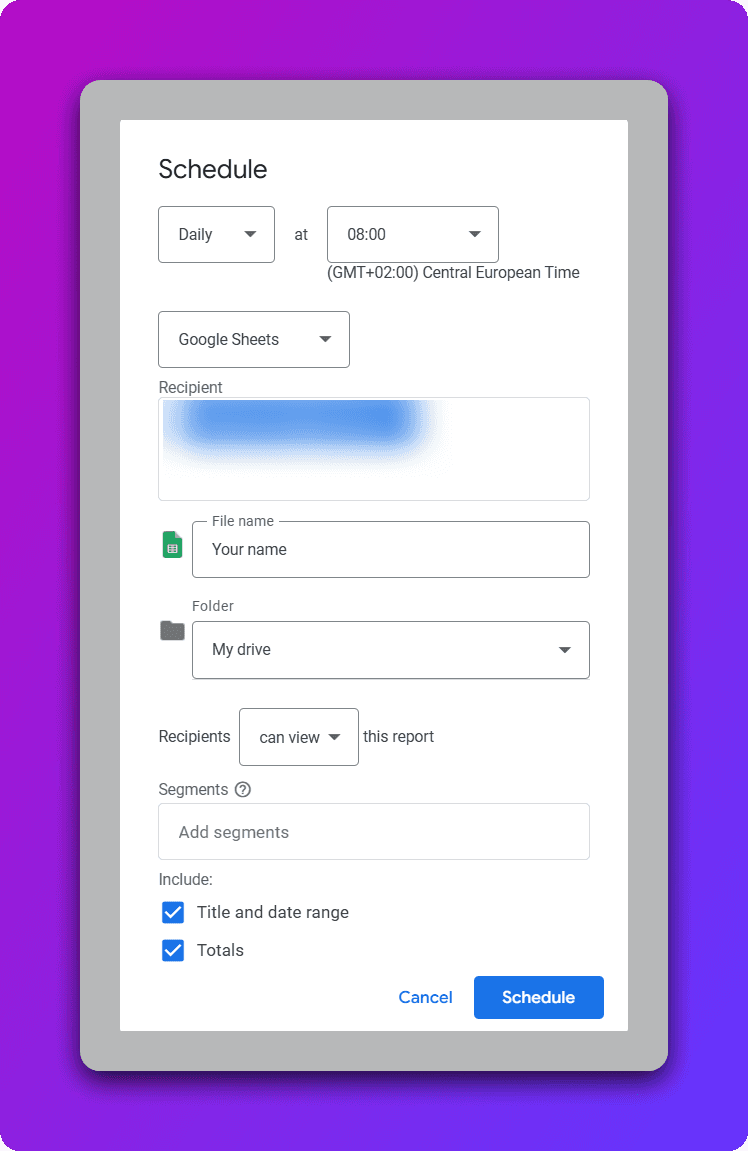
Now, this spreadsheet will be generated for the first time and on a daily basis on the time you select. The URL to this spreadsheet is crucial, because this is what will be used for the script itself.
Manual updating script
Refer to the script below, all that you need to adjust is the spreadsheet URL variable.
However, since Google creates a new spreadsheet every time it's scheduled, we need to update the URL everytime we want to run it in the script. So this is good if you are doing an infrequent analysis, but less ideal for constant monitoring. Read on, there's also a solution for that!
function main() {
var spreadsheetUrl = '';
var spreadsheet = SpreadsheetApp.openByUrl(spreadsheetUrl);
var inputSheet = spreadsheet.getSheets()[0];
var metrics = [
{ name: 'Top of Page Rate', columnIndex: 5 },
{ name: 'Abs. Top of Page Rate', columnIndex: 6 },
{ name: 'Position Above Rate', columnIndex: 4 },
{ name: 'Overlap Rate', columnIndex: 3 },
{ name: 'Outranking Share', columnIndex: 7 },
{ name: 'Impression Share', columnIndex: 2 }
];
var dataRange = inputSheet.getDataRange();
var data = dataRange.getValues();
var summarySheet = createSummaryTabPlaceholder(spreadsheet);
var createdCharts = [];
var tabPosition = 2;
metrics.forEach(function(metric) {
var chart = createMetricTab(spreadsheet, data, metric, tabPosition);
if (chart) {
createdCharts.push({
chart: chart,
metricName: metric.name
});
tabPosition++;
}
});
populateSummaryTab(spreadsheet, summarySheet, createdCharts);
Logger.log('Charts created successfully');
}
function createMetricTab(spreadsheet, data, metric, tabPosition) {
var sheetName = metric.name.replace(/\s+/g, '_').toUpperCase().replace('ABS.', 'ABSOLUTE');
var metricSheet = spreadsheet.getSheetByName(sheetName);
if (metricSheet) {
spreadsheet.deleteSheet(metricSheet);
}
metricSheet = spreadsheet.insertSheet(sheetName, tabPosition);
var dateMap = {};
var displayUrls = new Set();
for (var i = 1; i < data.length; i++) {
var row = data[i];
var dateString = row[0];
var displayUrl = row[1];
var metricValue = parseFloat(row[metric.columnIndex]) || 0;
var date = parseDateString(dateString);
if (!date) {
Logger.log('Skipping invalid date: ' + dateString);
continue;
}
if (!dateMap[date]) {
dateMap[date] = {};
}
dateMap[date][displayUrl] = metricValue;
displayUrls.add(displayUrl);
}
var displayUrlArray = Array.from(displayUrls).sort();
displayUrlArray = displayUrlArray.filter(function(url) {
var hasNonZero = false;
for (var date in dateMap) {
if (dateMap[date][url] && dateMap[date][url] !== 0) {
hasNonZero = true;
break;
}
}
return hasNonZero;
});
if (displayUrlArray.length === 0) {
Logger.log('No data found for metric: ' + metric.name);
return null;
}
var headerRow = ['Date'].concat(displayUrlArray.map(function(url) {
return metric.name + ' ' + url;
}));
metricSheet.appendRow(headerRow);
var sortedDates = Object.keys(dateMap).map(function(date) {
return new Date(date);
}).sort(function(a, b) {
return a - b;
});
for (var j = 0; j < sortedDates.length; j++) {
var date = sortedDates[j];
var rowData = [date];
displayUrlArray.forEach(function(displayUrl) {
rowData.push(dateMap[date][displayUrl] || 0);
});
metricSheet.appendRow(rowData);
}
var chart = createChart(metricSheet, metric.name, sortedDates.length, displayUrlArray);
if (chart) {
metricSheet.insertChart(chart);
}
return chart;
}
function createSummaryTabPlaceholder(spreadsheet) {
var summarySheet = spreadsheet.getSheetByName('SUMMARY');
if (summarySheet) {
spreadsheet.deleteSheet(summarySheet);
}
summarySheet = spreadsheet.insertSheet('SUMMARY', 1);
summarySheet.getRange(1, 1).setValue('AUCTION INSIGHTS SUMMARY - ALL METRICS');
summarySheet.getRange(1, 1).setFontSize(20).setFontWeight('bold');
return summarySheet;
}
function populateSummaryTab(spreadsheet, summarySheet, createdCharts) {
var chartsPerRow = 1;
var chartWidth = 20;
var chartHeight = 25;
var verticalSpacing = 5;
for (var i = 0; i < createdCharts.length; i++) {
var chartData = createdCharts[i];
var startRow = 3 + (i * (chartHeight + verticalSpacing));
var startCol = 1;
var originalSheetName = chartData.metricName.replace(/\s+/g, '_').toUpperCase().replace('ABS.', 'ABSOLUTE');
var originalSheet = spreadsheet.getSheetByName(originalSheetName);
if (originalSheet) {
var summaryChart = createSummaryChart(originalSheet, chartData.metricName, startRow, startCol);
if (summaryChart) {
summarySheet.insertChart(summaryChart);
}
}
}
}
function createSummaryChart(sourceSheet, metricName, startRow, startCol) {
var dataRange = sourceSheet.getDataRange();
var numRows = dataRange.getNumRows() - 1;
var numCols = dataRange.getNumColumns();
if (numRows <= 0 || numCols <= 1) {
return null;
}
var chart = sourceSheet.newChart()
.setChartType(Charts.ChartType.LINE)
.setOption('title', metricName)
.setOption('titleTextStyle', {fontSize: 14, bold: true})
.setOption('hAxis.title', 'Date')
.setOption('hAxis.titleTextStyle', {fontSize: 12})
.setOption('vAxis.title', metricName)
.setOption('vAxis.titleTextStyle', {fontSize: 12})
.setOption('legend.position', 'bottom')
.setOption('legend.textStyle', {fontSize: 12})
.setOption('width', 1200)
.setOption('height', 600)
.setPosition(startRow, startCol, 0, 0);
var dateRange = sourceSheet.getRange(2, 1, numRows);
chart.addRange(dateRange);
for (var col = 2; col <= numCols; col++) {
var seriesRange = sourceSheet.getRange(2, col, numRows);
var displayUrlName = sourceSheet.getRange(1, col).getValue().replace(metricName + ' ', '');
chart.addRange(seriesRange);
chart.setOption('series.' + (col - 2) + '.labelInLegend', displayUrlName);
}
return chart.build();
}
function parseDateString(dateString) {
var parts = dateString.split('-');
if (parts.length === 3) {
var year = parseInt(parts[0], 10);
var month = parseInt(parts[1], 10) - 1;
var day = parseInt(parts[2], 10);
return new Date(year, month, day);
}
return null;
}
function createChart(sheet, metricName, rowCount, displayUrlArray) {
var row = rowCount + 3;
var chart = sheet.newChart()
.setChartType(Charts.ChartType.LINE)
.setOption('title', metricName)
.setOption('hAxis.title', 'Date')
.setOption('vAxis.title', metricName)
.setOption('legend.position', 'bottom')
.setOption('legend.textStyle', {fontSize: 12})
.setOption('width', 600)
.setOption('height', 400)
.setPosition(row, 1, 0, 0);
var dateRange = sheet.getRange(2, 1, rowCount);
chart.addRange(dateRange);
for (var col = 2; col <= displayUrlArray.length + 1; col++) {
var seriesRange = sheet.getRange(2, col, rowCount);
var displayUrlName = sheet.getRange(1, col).getValue().replace(metricName + ' ', '');
chart.addRange(seriesRange);
chart.setOption('series.' + (col - 2) + '.labelInLegend', displayUrlName);
}
return chart.build();
}
Fully automated auction insights script
As said before, the issue with Google Ads scheduling is that it's creating a new spreadsheet every time. We can manually update the URL in the script above, but it's not ideal for constant monitoring purposes. Therefore, here's a guide on how to completely automate it. In a nutshell:
We will create a Google Apps script that gets the most recent created spreadsheet with the auction insights data (Google Ads scripts can't do this)
This new Google Apps script will update a spreadsheet everyday with simply just listing the most recent URL of the auction insights report you've generated based on name.
The Google Ads script will use this spreadsheet to fetch the most recent spreadsheet URL updated by Google Apps scripts.
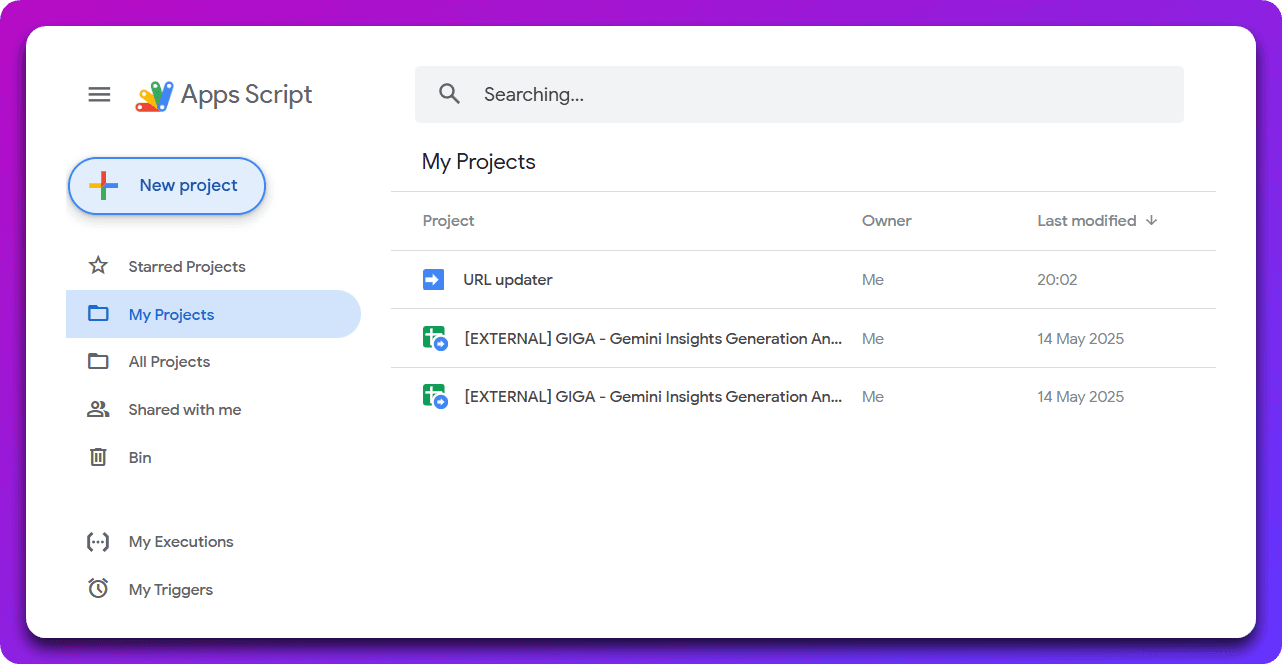
Now to do this, we need to use a Google Apps script. First, go to script.google.com, login with the same account you access both Google Drive and Google Ads with. Create a new project:
Now copy paste the following script, you need to adjust the CONFIG_SPREADSHEET_URL. This is the spreadsheet URL which this script will write to. Then the REPORT_NAME is the exact name (case sensitive!) of the Auction insights report that's being scheduled. The default name for it is Auction insights report so I'm using that here as well. This is the name that you used in the first setup. To remind you, the basic purpose of this apps script is to get the most recent spreadsheet URL containing your scheduled Auction Insights data so that the Google Ads script can use that.
function updateConfigWithLatestReport() {
var CONFIG_SPREADSHEET_URL = 'https://docs.google.com/spreadsheets/d/YOUR_CONFIG_SHEET_ID/edit';
var REPORT_NAME = 'Auction insights report';
Logger.log('Searching for latest report with exact name: ' + REPORT_NAME);
var latestReport = findMostRecentSpreadsheet(REPORT_NAME);
if (!latestReport) {
Logger.log('ERROR: No spreadsheet found with exact name: ' + REPORT_NAME);
return;
}
var reportUrl = latestReport.getUrl();
var reportName = latestReport.getName();
var lastModified = latestReport.getLastUpdated();
Logger.log('Found latest report: ' + reportName);
Logger.log('Last modified: ' + lastModified);
Logger.log('URL: ' + reportUrl);
var configSpreadsheet = SpreadsheetApp.openByUrl(CONFIG_SPREADSHEET_URL);
var configSheet = configSpreadsheet.getSheets()[0];
configSheet.getRange('A1').setValue(reportUrl);
configSheet.getRange('B1').setValue(reportName);
configSheet.getRange('C1').setValue(lastModified);
Logger.log('Config spreadsheet updated successfully!');
}
function findMostRecentSpreadsheet(exactName) {
var files = DriveApp.searchFiles(
'title = "' + exactName + '" and mimeType = "' + MimeType.GOOGLE_SHEETS + '"'
);
var mostRecentFile = null;
var mostRecentDate = null;
while (files.hasNext()) {
var file = files.next();
var lastUpdated = file.getLastUpdated();
if (!mostRecentDate || lastUpdated > mostRecentDate) {
mostRecentDate = lastUpdated;
mostRecentFile = file;
}
}
return mostRecentFile;
}
function createDailyTrigger() {
var triggers = ScriptApp.getProjectTriggers();
for (var i = 0; i < triggers.length; i++) {
ScriptApp.deleteTrigger(triggers[i]);
}
ScriptApp.newTrigger('updateConfigWithLatestReport')
.timeBased()
.everyDays(1)
.atHour(8)
.create();
Logger.log('Daily trigger created successfully!');
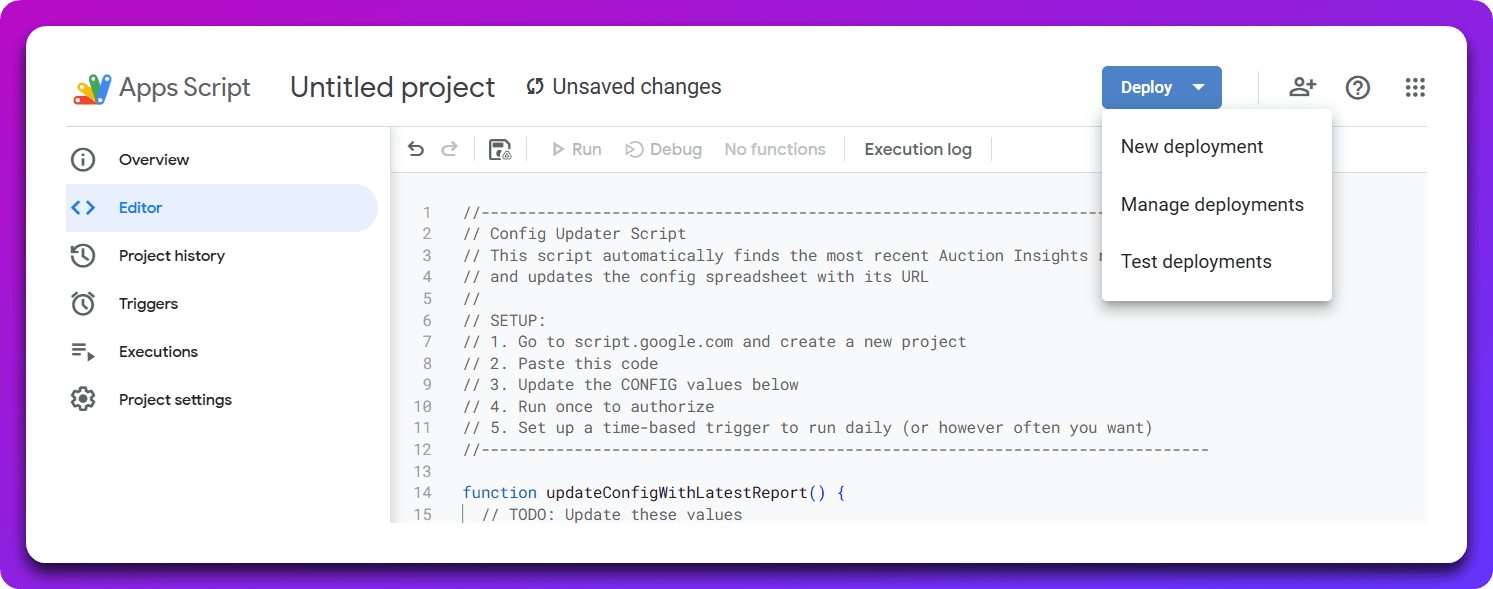
}Once you've copy pasted the script, give it a name and now we need to deploy it: by pressing Deploy and then new deployment.
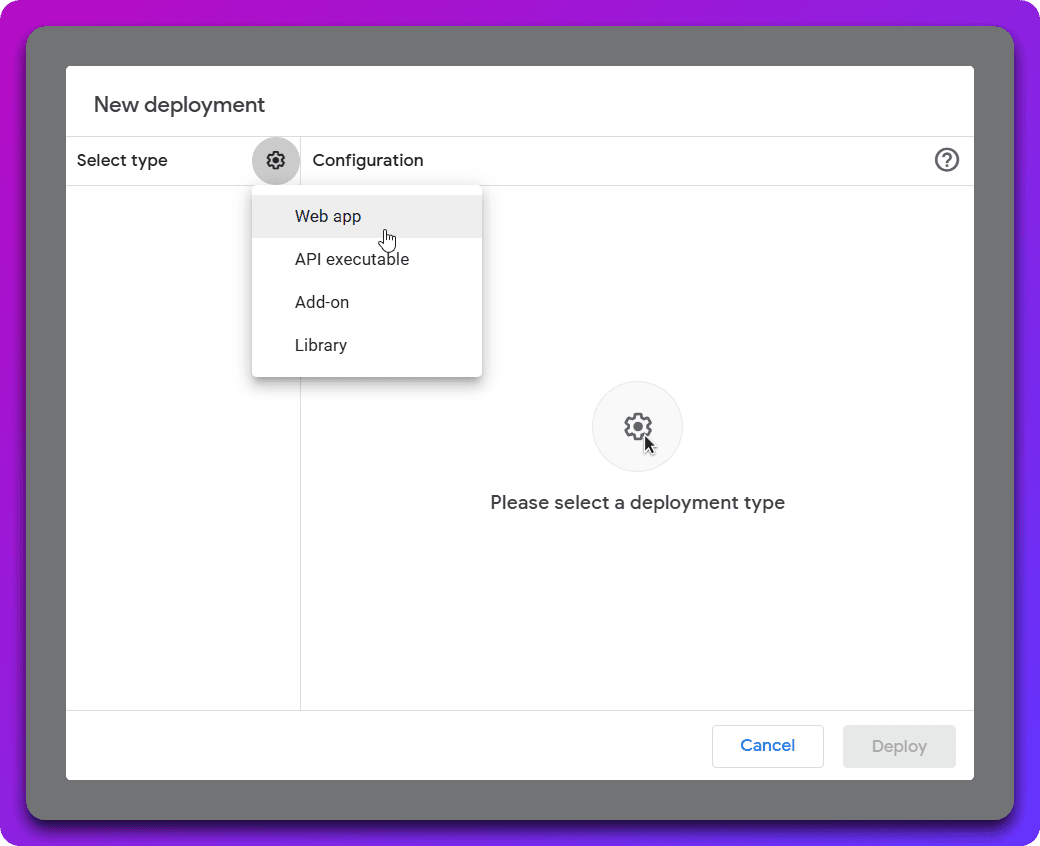
Deploy it as a web app, like so:
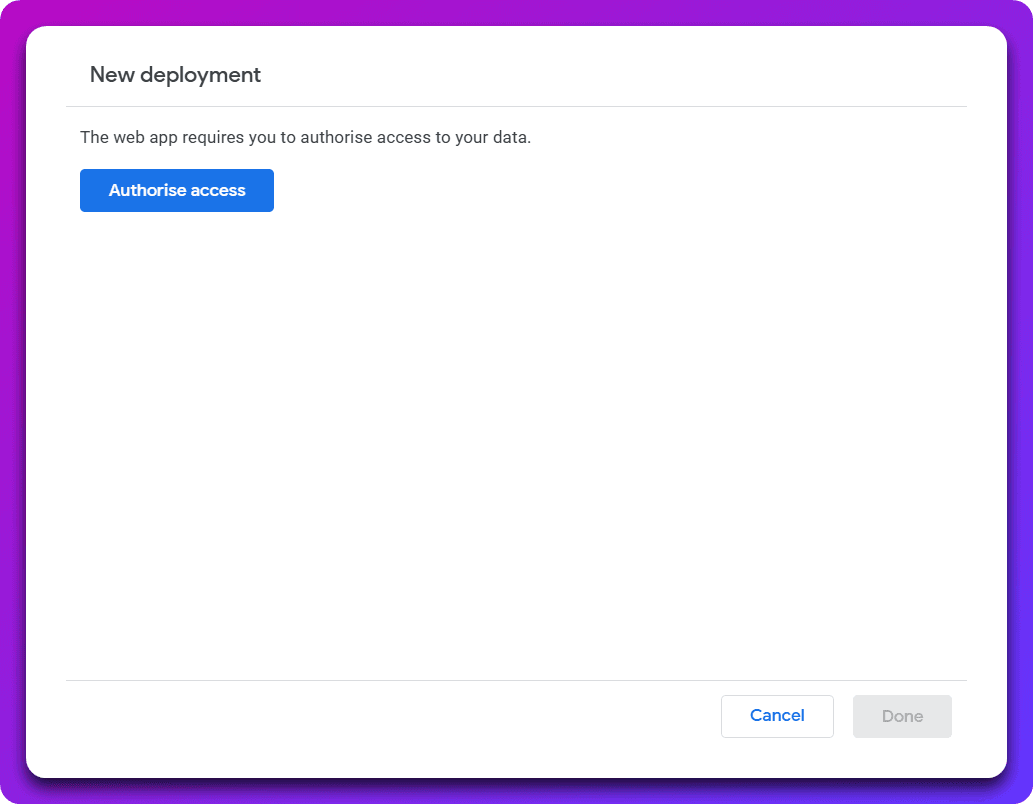
The next step is to authorize, again use the same account you have access to Google Ads and Drive with. You'll get some warnings that Google hasn't authorized this application and there's an option to continue.
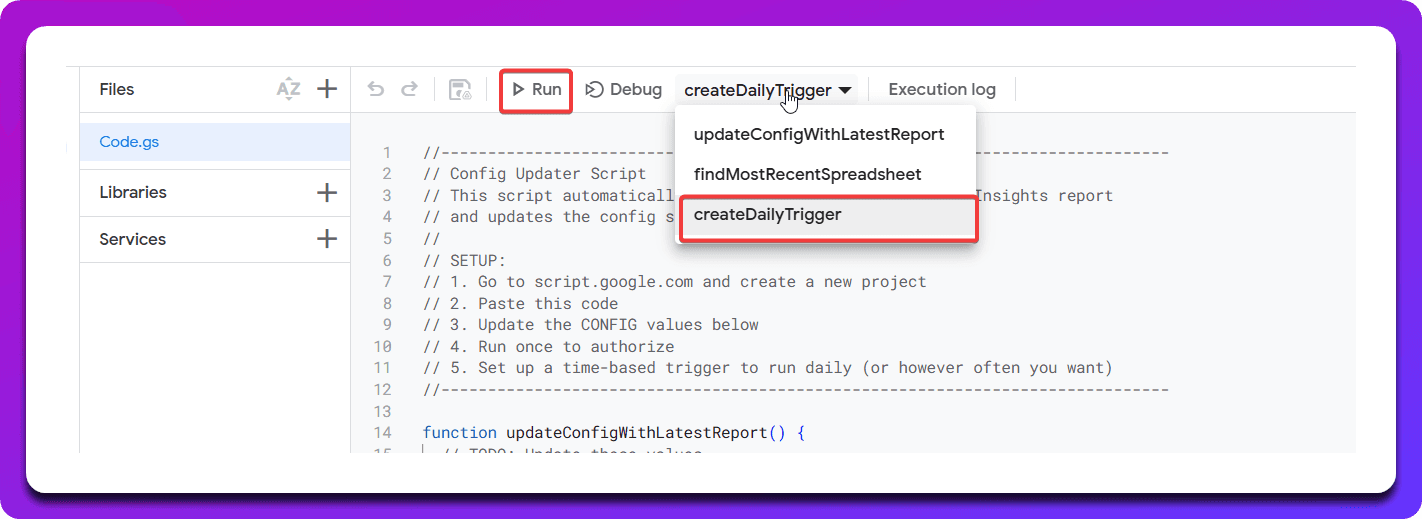
Now we need to create the scheduling of this report. Select createDailyTrigger to create a first scheduler. By default its set at 8AM (GMT time). You don't need to adjust it in the code, we can adjust it later so you can just run it.
If you want to adjust the timing go to triggers and then adjust the before-mentioned trigger:

Now we can go back to the app and do a first run and see if it works, use the updateConfigWithLatestReport function and do a run. You should see the logging below.
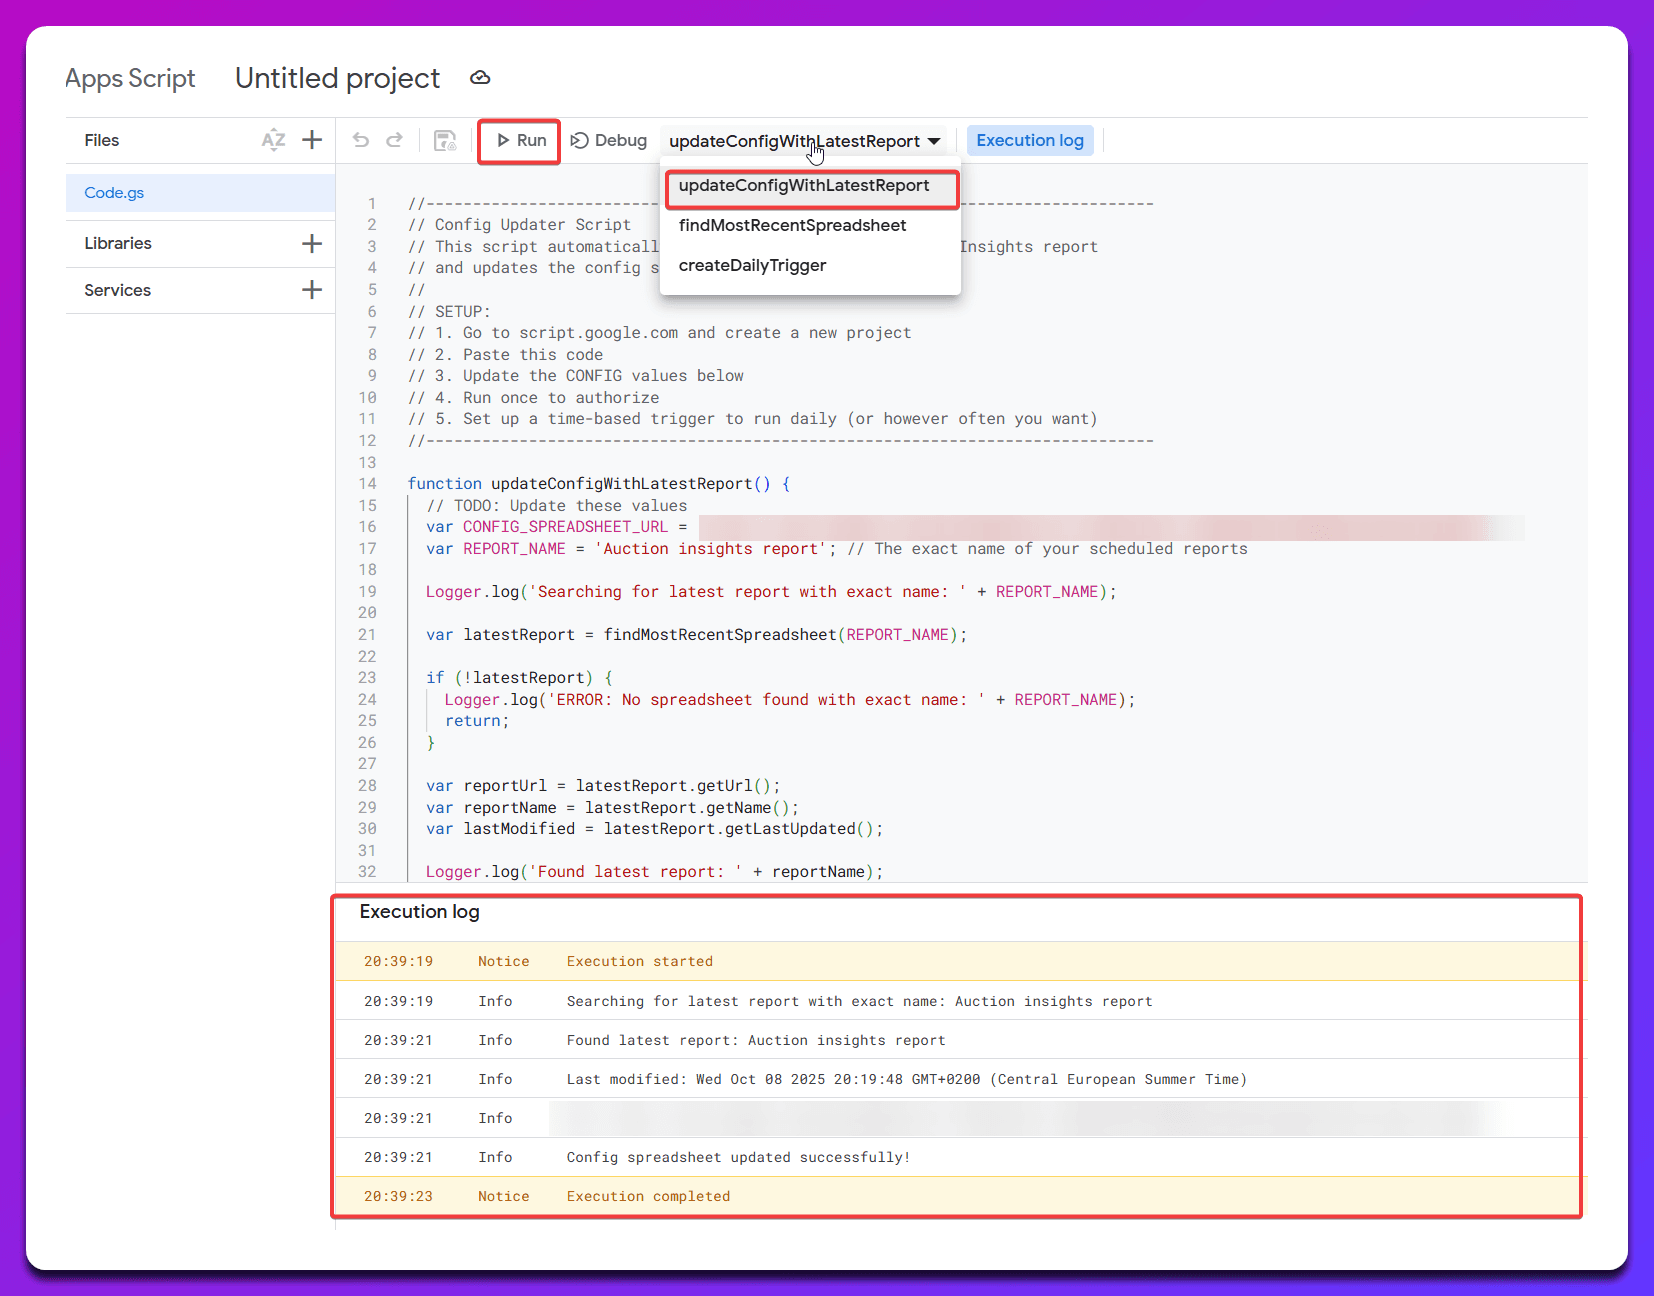
Great! Now the spreadsheet is updated for the first time and automatically gets updated with a new URL every day at 8AM GMT containing the most recent spreadsheet URL. Your spreadsheet should look like this:
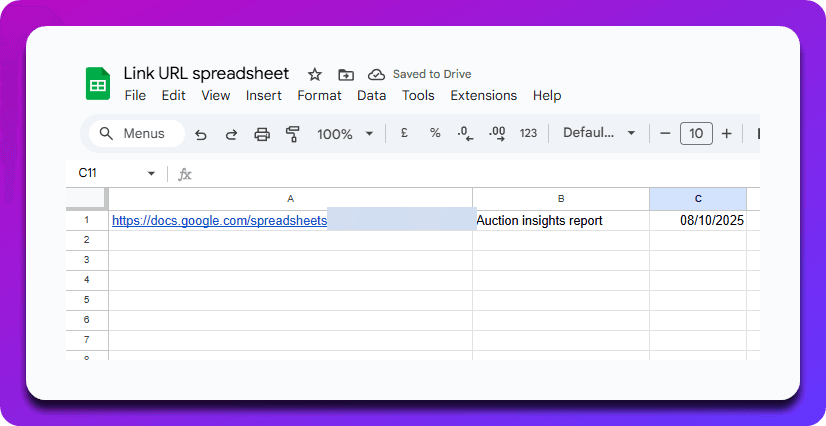
Now we just use the URL of this link URL spreadsheet in this adjusted fully automated version of the Google Ads script. To summarize, the flow is:
You schedule a Google Ads auction insights report, Google creates a new spreadsheet every day or period that it's scheduled
We create a Google Apps script to find the most recent spreadsheet URL, and that spreadsheet URL is output into another spreadsheet that the Google Ads script uses
Now, the most recent Auction insights spreadsheet created by Google will automatically be updated with this script!
In terms of scheduling:
The Google ads scheduled auction insights spreadsheet runs first
The Google Apps script runs second
The Google Ads script runs third
function main() {
var configSpreadsheetUrl = 'https://docs.google.com/spreadsheets/d/YOUR_CONFIG_SPREADSHEET_ID/edit';
var configSpreadsheet = SpreadsheetApp.openByUrl(configSpreadsheetUrl);
var configSheet = configSpreadsheet.getSheets()[0];
var spreadsheetUrl = configSheet.getRange('A1').getValue();
if (!spreadsheetUrl) {
Logger.log('ERROR: No spreadsheet URL found in config spreadsheet cell A1');
return;
}
var spreadsheet = SpreadsheetApp.openByUrl(spreadsheetUrl);
var inputSheet = spreadsheet.getSheets()[0];
var metrics = [
{ name: 'Top of Page Rate', columnIndex: 5 },
{ name: 'Abs. Top of Page Rate', columnIndex: 6 },
{ name: 'Position Above Rate', columnIndex: 4 },
{ name: 'Overlap Rate', columnIndex: 3 },
{ name: 'Outranking Share', columnIndex: 7 },
{ name: 'Impression Share', columnIndex: 2 }
];
var dataRange = inputSheet.getDataRange();
var data = dataRange.getValues();
var summarySheet = createSummaryTabPlaceholder(spreadsheet);
var createdCharts = [];
var tabPosition = 2;
metrics.forEach(function(metric) {
var chart = createMetricTab(spreadsheet, data, metric, tabPosition);
if (chart) {
createdCharts.push({
chart: chart,
metricName: metric.name
});
tabPosition++;
}
});
populateSummaryTab(spreadsheet, summarySheet, createdCharts);
Logger.log('Charts created successfully');
}
function createMetricTab(spreadsheet, data, metric, tabPosition) {
var sheetName = metric.name.replace(/\s+/g, '_').toUpperCase().replace('ABS.', 'ABSOLUTE');
var metricSheet = spreadsheet.getSheetByName(sheetName);
if (metricSheet) {
spreadsheet.deleteSheet(metricSheet);
}
metricSheet = spreadsheet.insertSheet(sheetName, tabPosition);
var dateMap = {};
var displayUrls = new Set();
for (var i = 1; i < data.length; i++) {
var row = data[i];
var dateString = row[0];
var displayUrl = row[1];
var metricValue = parseFloat(row[metric.columnIndex]) || 0;
var date = parseDateString(dateString);
if (!date) {
Logger.log('Skipping invalid date: ' + dateString);
continue;
}
if (!dateMap[date]) {
dateMap[date] = {};
}
dateMap[date][displayUrl] = metricValue;
displayUrls.add(displayUrl);
}
var displayUrlArray = Array.from(displayUrls).sort();
displayUrlArray = displayUrlArray.filter(function(url) {
var hasNonZero = false;
for (var date in dateMap) {
if (dateMap[date][url] && dateMap[date][url] !== 0) {
hasNonZero = true;
break;
}
}
return hasNonZero;
});
if (displayUrlArray.length === 0) {
Logger.log('No data found for metric: ' + metric.name);
return null;
}
var headerRow = ['Date'].concat(displayUrlArray.map(function(url) {
return metric.name + ' ' + url;
}));
metricSheet.appendRow(headerRow);
var sortedDates = Object.keys(dateMap).map(function(date) {
return new Date(date);
}).sort(function(a, b) {
return a - b;
});
for (var j = 0; j < sortedDates.length; j++) {
var date = sortedDates[j];
var rowData = [date];
displayUrlArray.forEach(function(displayUrl) {
rowData.push(dateMap[date][displayUrl] || 0);
});
metricSheet.appendRow(rowData);
}
var chart = createChart(metricSheet, metric.name, sortedDates.length, displayUrlArray);
if (chart) {
metricSheet.insertChart(chart);
}
return chart;
}
function createSummaryTabPlaceholder(spreadsheet) {
var summarySheet = spreadsheet.getSheetByName('SUMMARY');
if (summarySheet) {
spreadsheet.deleteSheet(summarySheet);
}
summarySheet = spreadsheet.insertSheet('SUMMARY', 1);
summarySheet.getRange(1, 1).setValue('AUCTION INSIGHTS SUMMARY - ALL METRICS');
summarySheet.getRange(1, 1).setFontSize(20).setFontWeight('bold');
return summarySheet;
}
function populateSummaryTab(spreadsheet, summarySheet, createdCharts) {
var chartsPerRow = 1;
var chartWidth = 20;
var chartHeight = 25;
var verticalSpacing = 5;
for (var i = 0; i < createdCharts.length; i++) {
var chartData = createdCharts[i];
var startRow = 3 + (i * (chartHeight + verticalSpacing));
var startCol = 1;
var originalSheetName = chartData.metricName.replace(/\s+/g, '_').toUpperCase().replace('ABS.', 'ABSOLUTE');
var originalSheet = spreadsheet.getSheetByName(originalSheetName);
if (originalSheet) {
var summaryChart = createSummaryChart(originalSheet, chartData.metricName, startRow, startCol);
if (summaryChart) {
summarySheet.insertChart(summaryChart);
}
}
}
}
function createSummaryChart(sourceSheet, metricName, startRow, startCol) {
var dataRange = sourceSheet.getDataRange();
var numRows = dataRange.getNumRows() - 1;
var numCols = dataRange.getNumColumns();
if (numRows <= 0 || numCols <= 1) {
return null;
}
var chart = sourceSheet.newChart()
.setChartType(Charts.ChartType.LINE)
.setOption('title', metricName)
.setOption('titleTextStyle', {fontSize: 14, bold: true})
.setOption('hAxis.title', 'Date')
.setOption('hAxis.titleTextStyle', {fontSize: 12})
.setOption('vAxis.title', metricName)
.setOption('vAxis.titleTextStyle', {fontSize: 12})
.setOption('legend.position', 'bottom')
.setOption('legend.textStyle', {fontSize: 12})
.setOption('width', 1200)
.setOption('height', 600)
.setPosition(startRow, startCol, 0, 0);
var dateRange = sourceSheet.getRange(2, 1, numRows);
chart.addRange(dateRange);
for (var col = 2; col <= numCols; col++) {
var seriesRange = sourceSheet.getRange(2, col, numRows);
var displayUrlName = sourceSheet.getRange(1, col).getValue().replace(metricName + ' ', '');
chart.addRange(seriesRange);
chart.setOption('series.' + (col - 2) + '.labelInLegend', displayUrlName);
}
return chart.build();
}
function parseDateString(dateString) {
var parts = dateString.split('-');
if (parts.length === 3) {
var year = parseInt(parts[0], 10);
var month = parseInt(parts[1], 10) - 1;
var day = parseInt(parts[2], 10);
return new Date(year, month, day);
}
return null;
}
function createChart(sheet, metricName, rowCount, displayUrlArray) {
var row = rowCount + 3;
var chart = sheet.newChart()
.setChartType(Charts.ChartType.LINE)
.setOption('title', metricName)
.setOption('hAxis.title', 'Date')
.setOption('vAxis.title', metricName)
.setOption('legend.position', 'bottom')
.setOption('legend.textStyle', {fontSize: 12})
.setOption('width', 600)
.setOption('height', 400)
.setPosition(row, 1, 0, 0);
var dateRange = sheet.getRange(2, 1, rowCount);
chart.addRange(dateRange);
for (var col = 2; col <= displayUrlArray.length + 1; col++) {
var seriesRange = sheet.getRange(2, col, rowCount);
var displayUrlName = sheet.getRange(1, col).getValue().replace(metricName + ' ', '');
chart.addRange(seriesRange);
chart.setOption('series.' + (col - 2) + '.labelInLegend', displayUrlName);
}
return chart.build();
}
